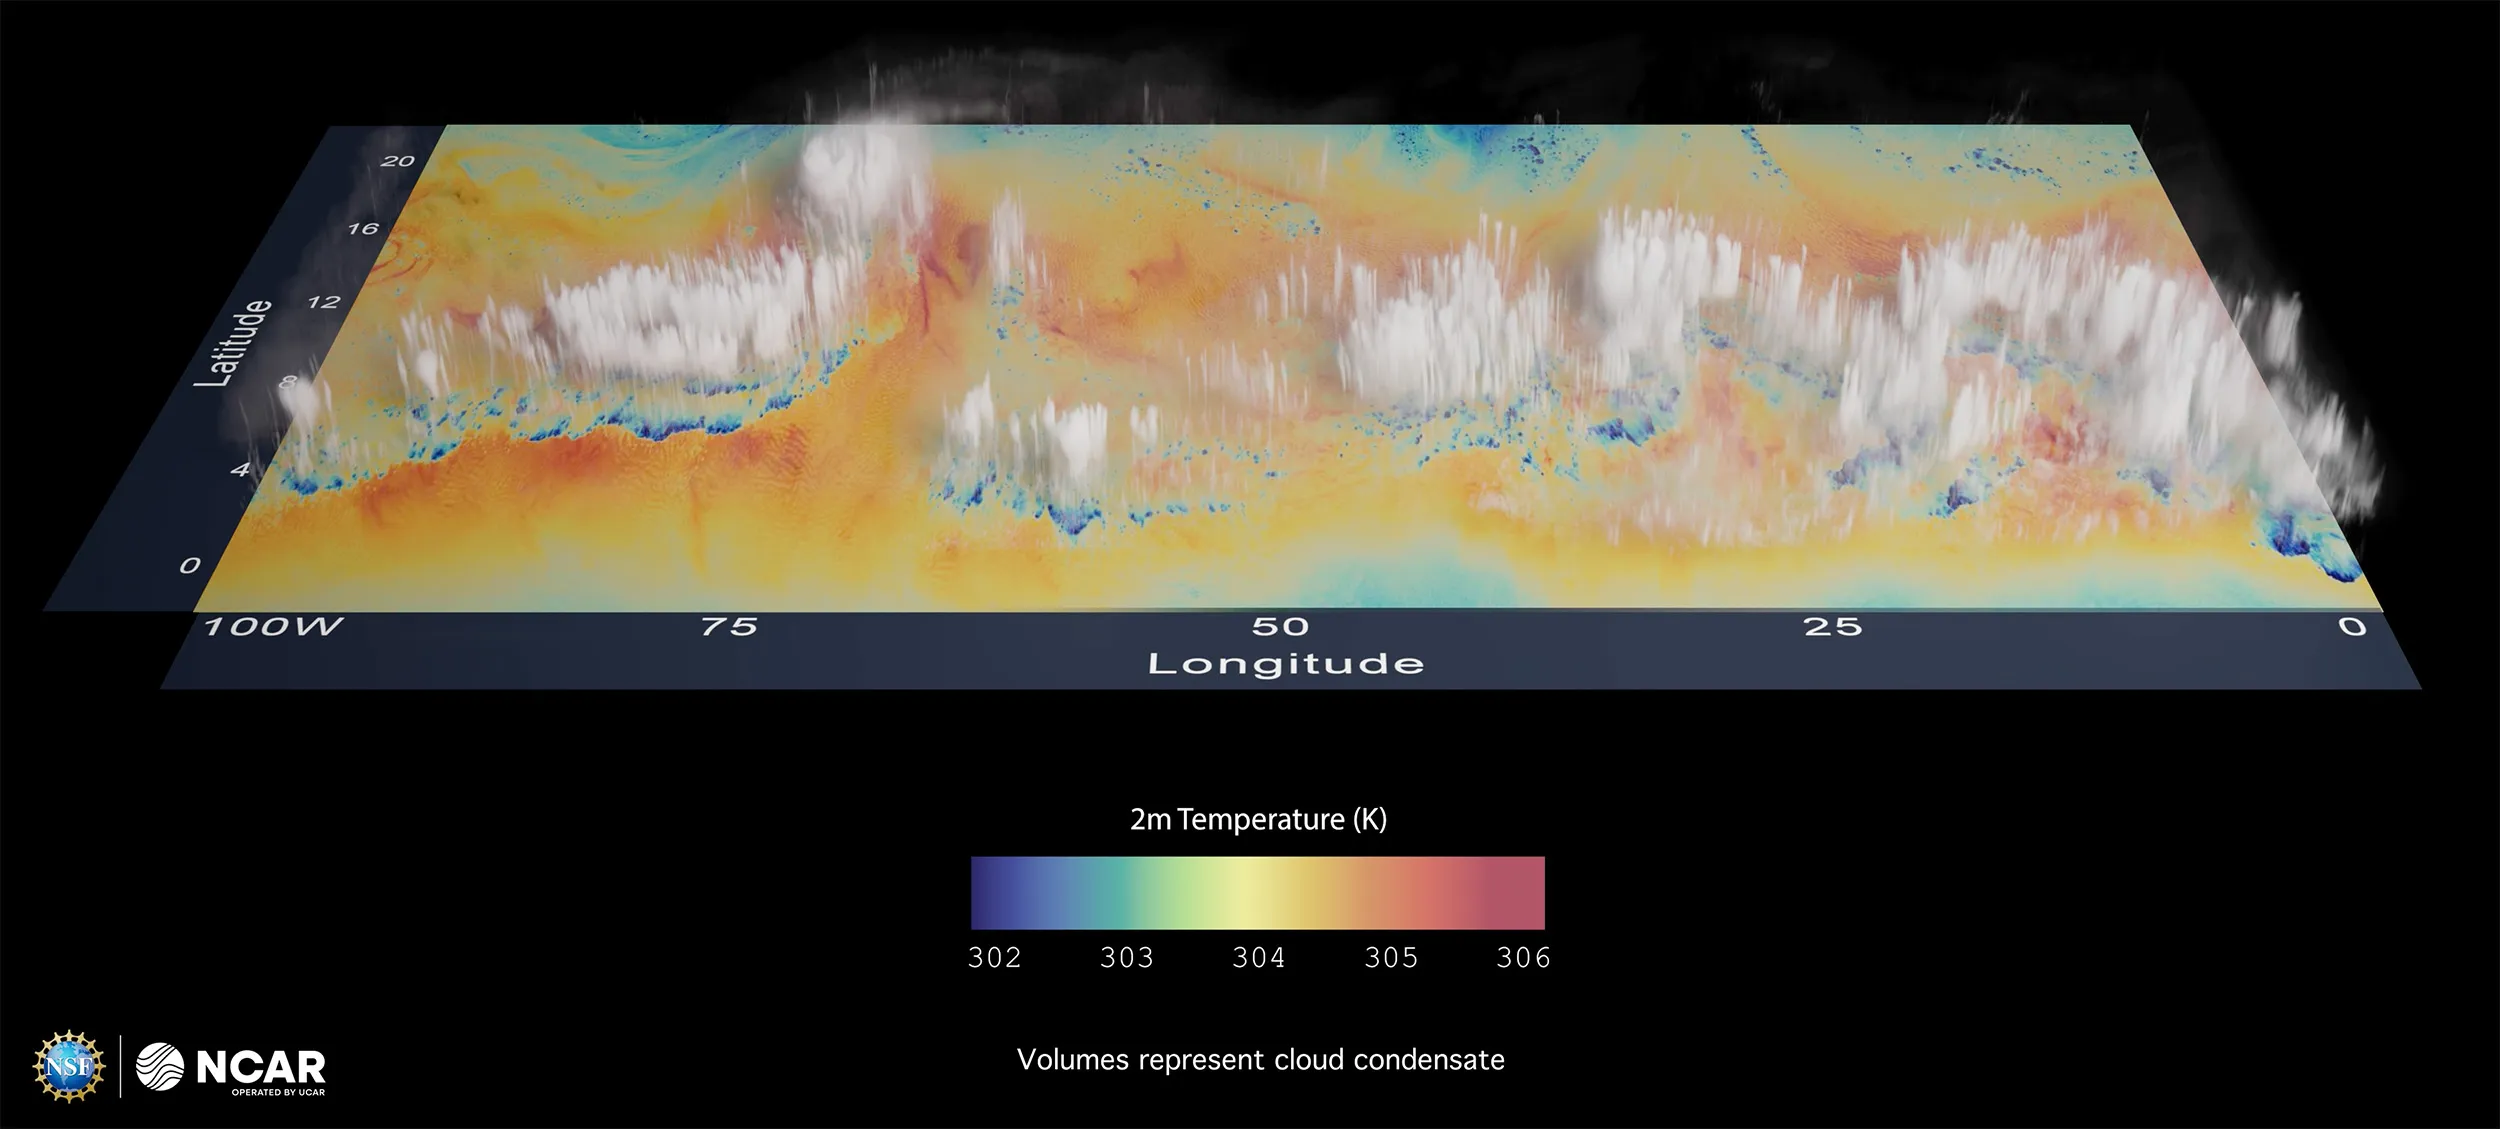
The data come from an aquaplanet simulation produced with the Model for Prediction Across Scale-Atmosphere (MPAS-A). The simulation was produced by configuring MPAS-A as a water-covered sphere with a zonally symmetric sea-surface temperature profile. The visualization shows that the simulation captures convective storms in the tropics, including tropical cyclones, and their near-surface interactions.
Publication: https://agupubs.onlinelibrary.wiley.com/doi/full/10.1029/2025MS005119
Rosimar Rios-Berrios (NCAR/MMM)
Matt Rehme (NCAR/CISL)
Model for Prediction Across Scales (MPAS)
Python, Blender
The National Center for Atmospheric Research is sponsored by the National Science Foundation. Any opinions, findings and conclusions or recommendations expressed in this material do not necessarily reflect the views of the National Science Foundation.