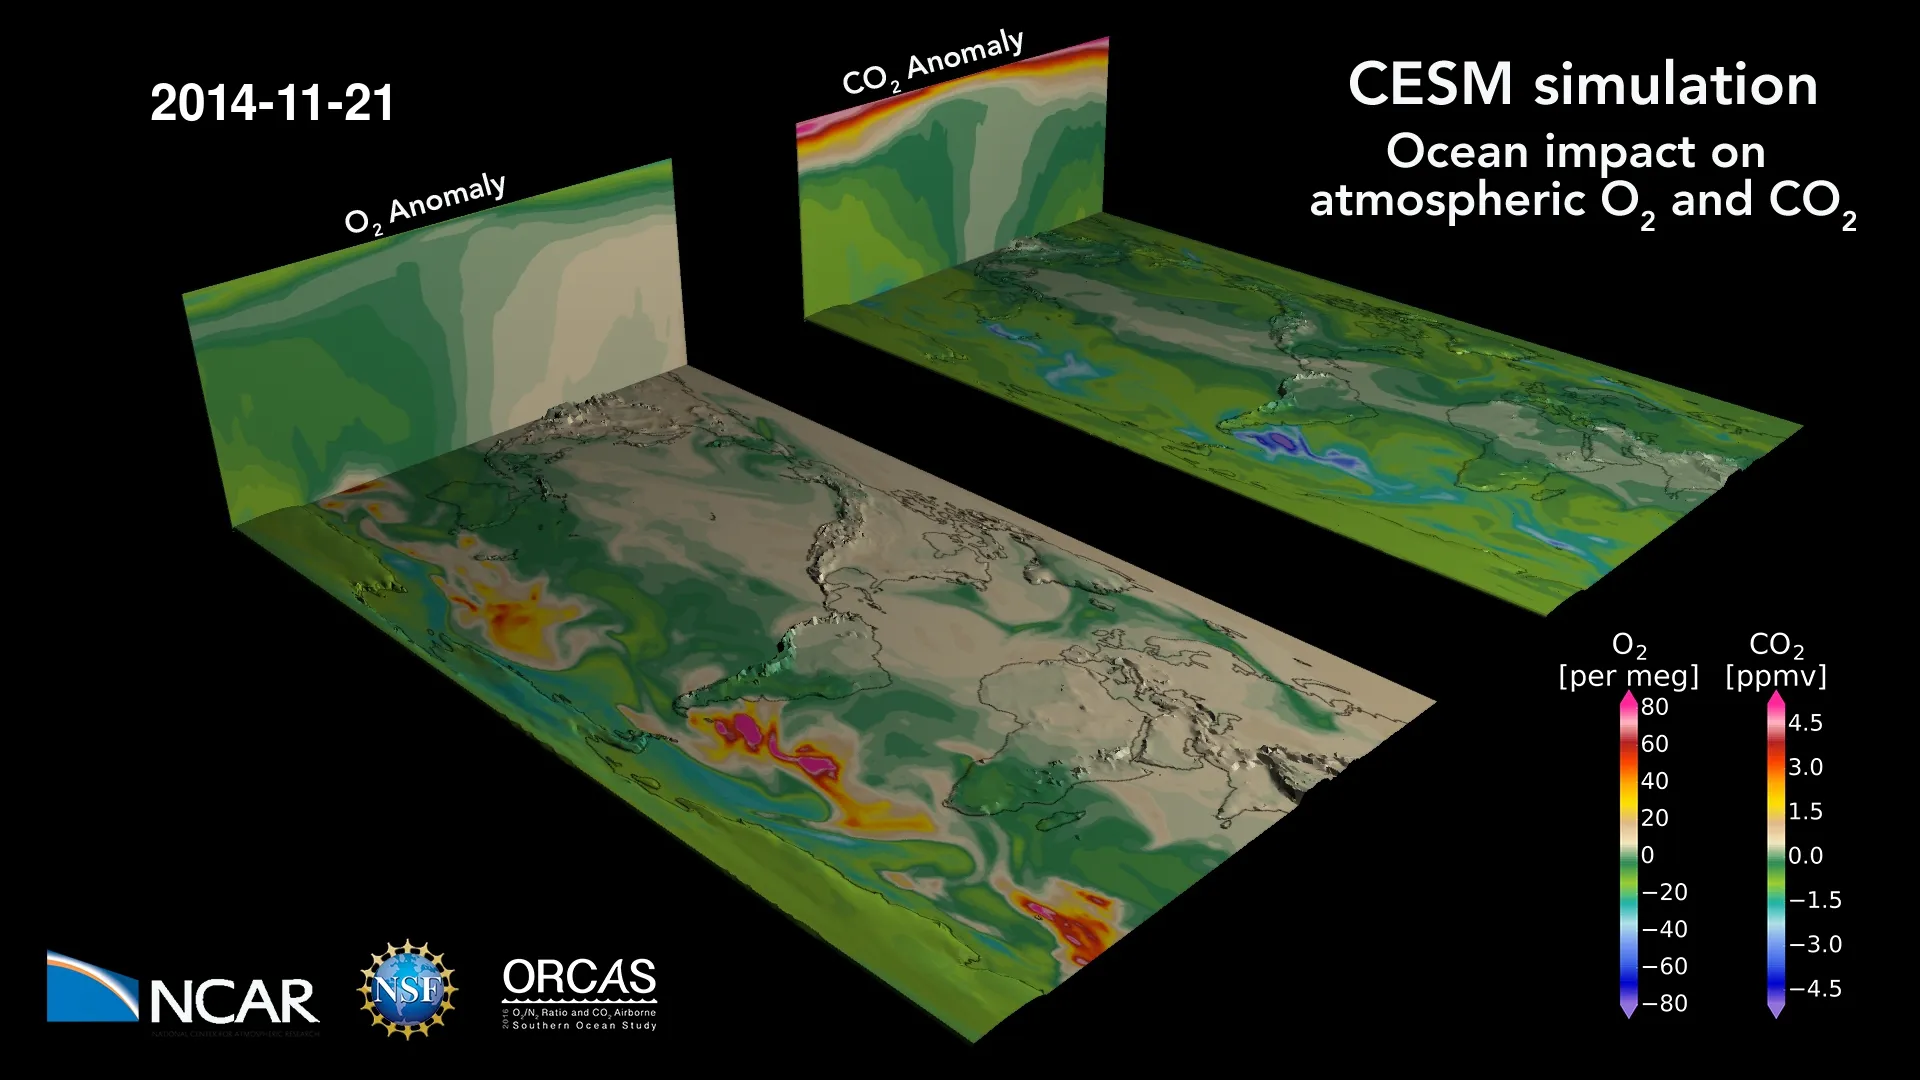
The ocean breathes: a map of oxygen and carbon dioxide variations in the atmosphere due to air-sea gas exchange, stirred by winds.
The ocean absorbs CO2 and releases O2 in the summer hemisphere, primarily due to photosynthesis (and warming, for O2) at the surface; the reverse happens during winter when the surface cools and deep mixing brings water low in O2 and rich in CO2 to the surface. The movie shows the imprint of these fluxes on the gas concentrations in the atmosphere. It’s an anomaly because the movie does not show total O2 and CO2 concentrations, but rather only the variation due to ocean fluxes. The total concentrations would include the imprint of the terrestrial biosphere and fossil fuel combustion, which are thus not included here.
This simulation was prepared in support of the ORCAS airborne field campaign, which measured CO2 and O2 in the air above the Southern Ocean in January and February of 2016. The movie shows ocean CO2 and O2 tracers in CAM (with nudging to GEOS5) in the model’s bottom level and the zonal mean throughout the column.
The tracers are anomaly concentrations: the spatial distributions are a result of exchange with the ocean and transport; a global mean trend has been subtracted from the data (which leads to an apparent CO2 accumulation in the stratosphere). The simulation is fully coupled at nominal 1° resolution. Air-sea fluxes are prognostic and computed by the ocean biogeochemistry model embedded in the 3D ocean GCM.

Matthew Long, NCAR Climate and Global Dynamics Laboratory
Britton Stephens, NCAR Earth Observing Laboratory
This research is enabled by CISL compute and storage resources, including Yellowstone a 1.5-petaflops high-performance IBM iDataPlex cluster, which features 72,576 Intel Sandy Bridge processors and 144.6 TB of memory.
Matthew Long, NCAR Climate and Global Dynamics Laboratory
Tim Scheitlin, NCAR Computational and Information Systems Laboratory
Bulletin of the American Meteorological Society (BAMS) Early Online Release of this study: https://journals.ametsoc.org/view/journals/bams/99/2/bams-d-16-0206.1.xml