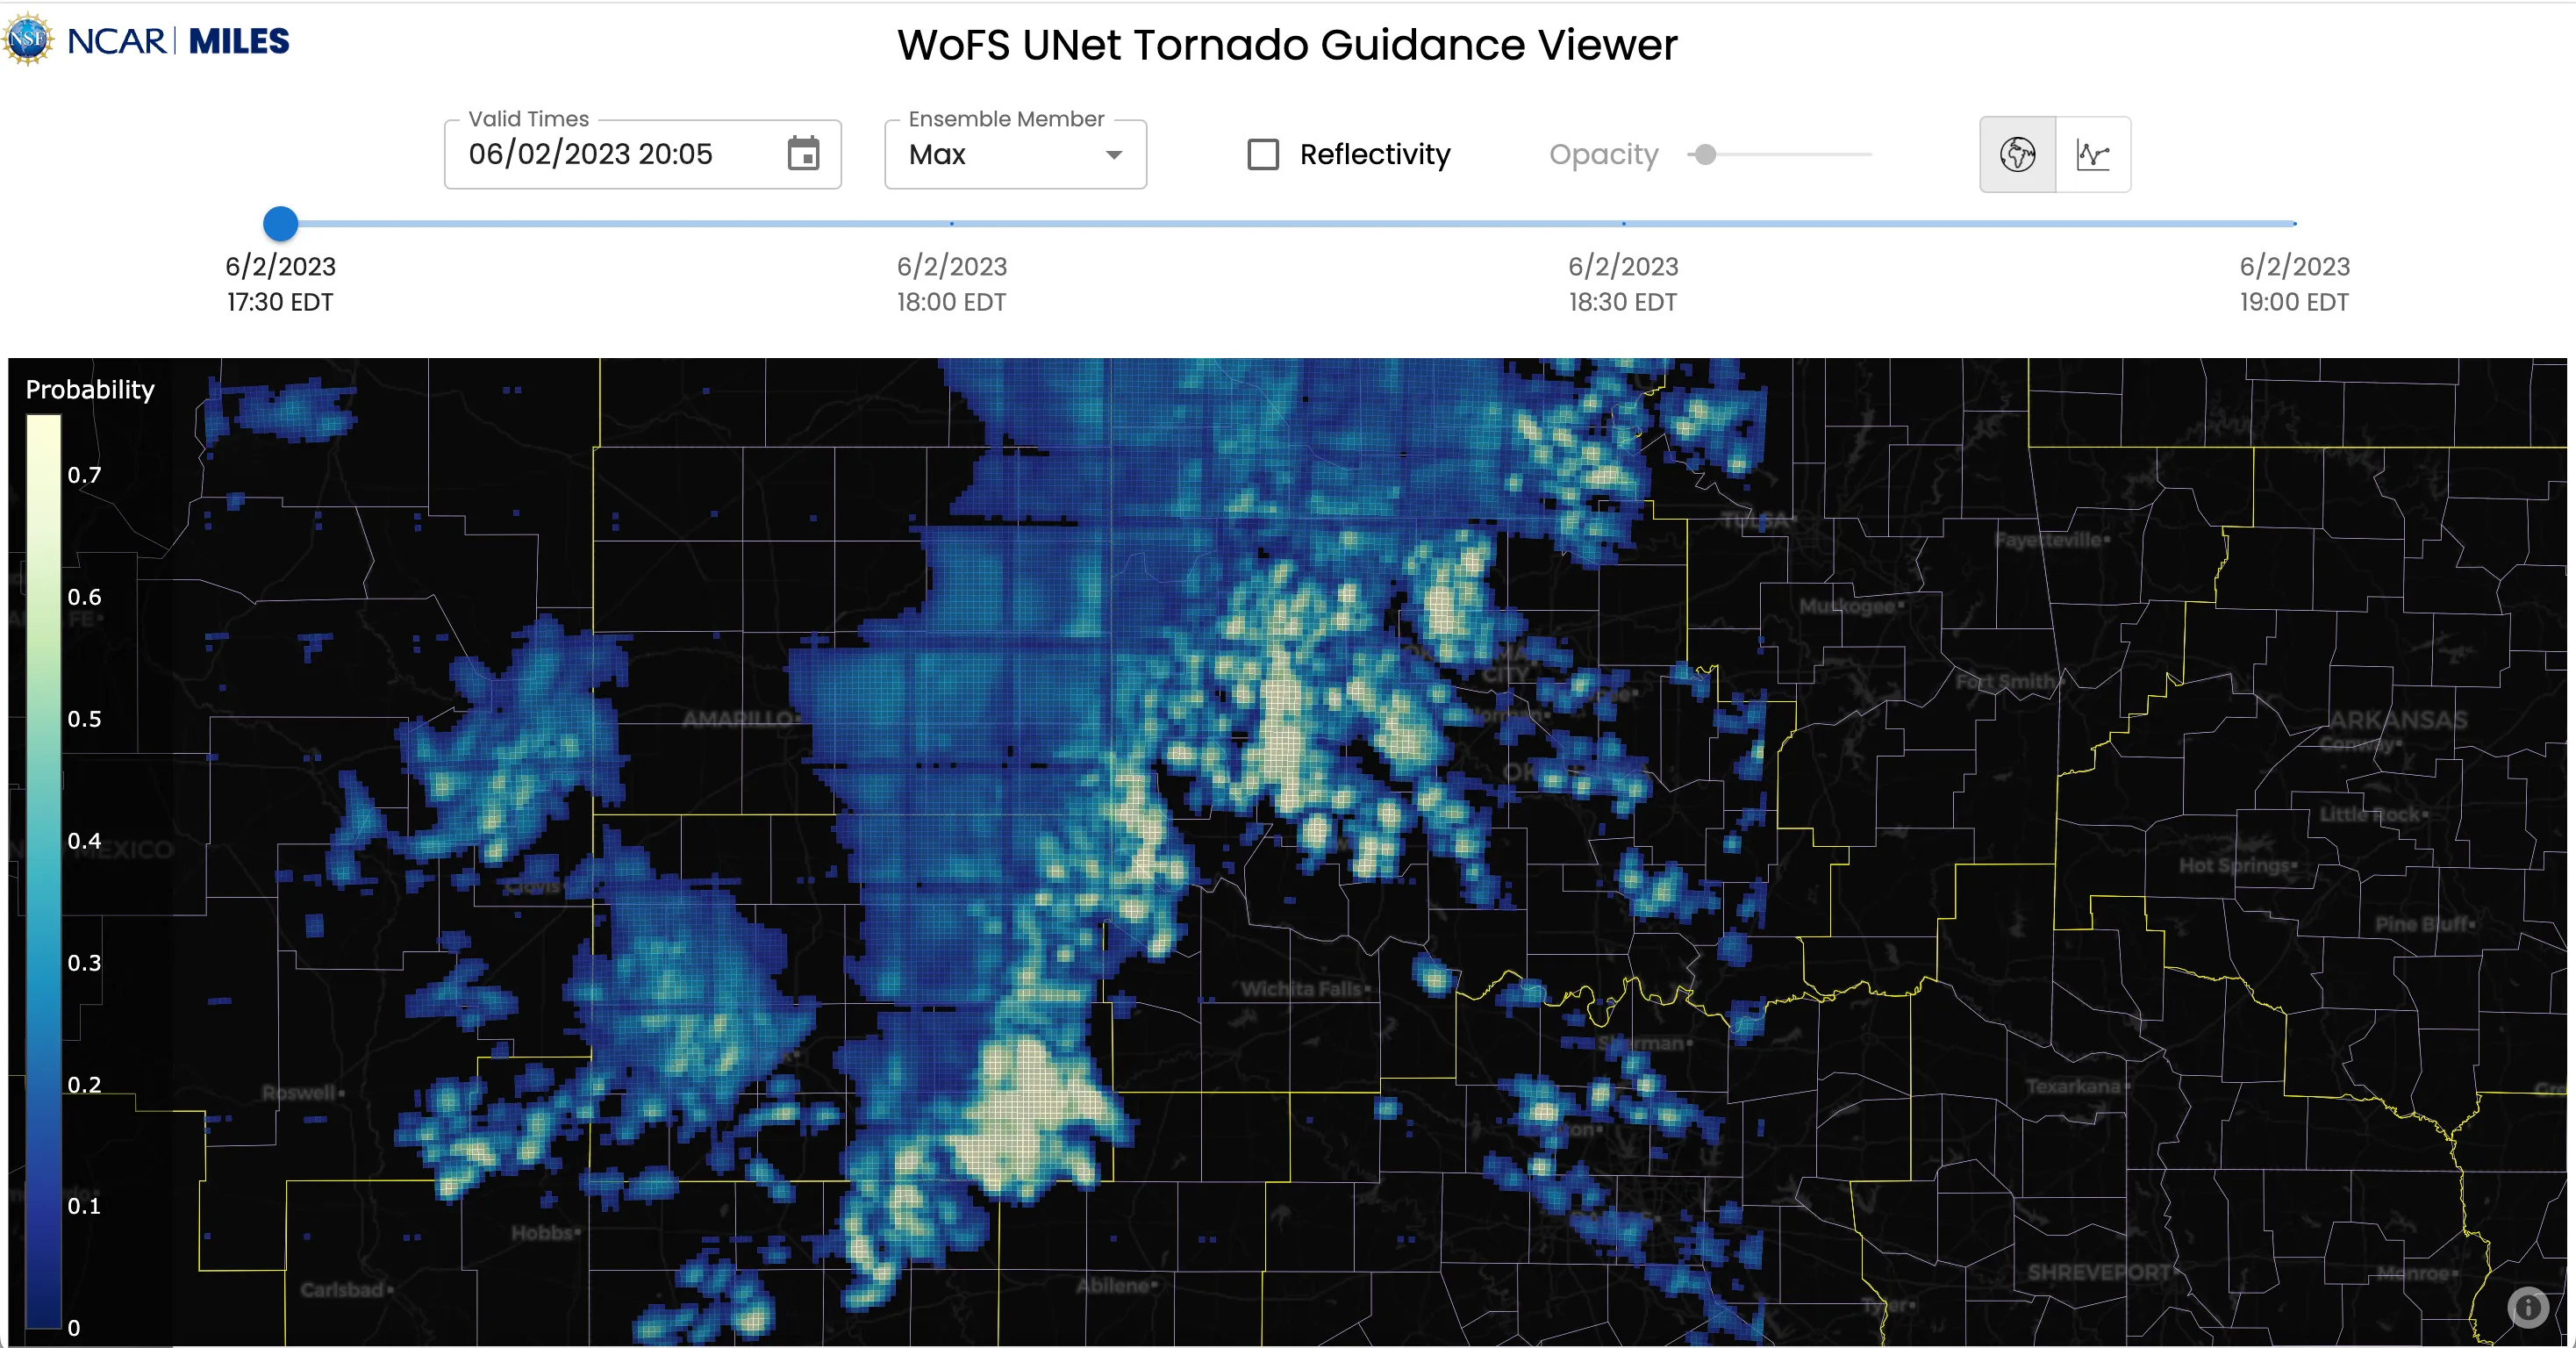
A recreation of an existing web visualization showing machine learning model prediction outputs of tornadoes on a map. This web interactive uses React and Next.js, two modern web frameworks, to organize the page layout and respond to user actions (such as changing the date and time, scrubbing through timestamps, choosing ensemble members to view, and clicking cells on the map to generate spaghetti plots).
This interactive took design inspiration from websites such as Pivotal Weather, which uses sliders that allow users to quickly compare model outputs over time.
The data underlying this visualization consists of msgpack files stored in an Azure cloud object storage bucket.
Science, computer modeling, and data all courtesy of the MILES group at NSF NCAR. Project completed in collaboration with DJ Gagne. The original dashboard from which this visualization was created was developed by Charlie Becker, Bill Petzke, and D J Gagne.
Tammy Zhang
Numerous open-source web libraries, including React, Next.js, and TanStack Query. Material UI was also used for the user controls.
See the repository for this interactive here.
The website this project iterated on was originally created by DJ Gagne and the MILES group, accessible here. See here for the code.